
Inferential statistics is like tasting one spoon of soup to understand the whole pot. The “whole pot” here means your target population (not literally the entire world, just the group you want to study). Since you can’t test everyone, you take a sample and use inferential stats to make a reliable estimate about the bigger group. It doesn’t give the ultimate truth with 100% certainty, but it helps us move much closer to understanding the reality of that larger population.

| Now, in one spoon you might not get a raisin or a cashew, because a small sample can’t include every element of the target audience or population (the whole pot of biryani). But the taste is enough for you to guess if the whole biryani is good-or if you should skip it and try something else. |
No need to stress over math’s here – we’re just focusing on the why, how, and where of inferential stats, not the calculations.
How Inferential Statistics is Done – Step by Step
We will discuss the topics in red- rest in the next blog
- Identify type of data (categorical / numerical, scale of measurement).
- Check assumptions (normality, variance, parametric vs non-parametric).
- Select appropriate statistical test (based on data type, groups, design).
- Set significance level (α, usually 0.05).
- Run the test (get test statistic & p-value).
- Check effect size (strength of relationship/difference).
- Interpret results in plain language.
- Report findings (test, statistic, p-value, effect size).
Identify type of data

| Categorical Data – It includes nominal scales, which are simply labels or names without any order (like gender, religion, or city), and ordinal scales, where the categories have a clear order but the gaps between them are not equal (like class ranks, education levels, or satisfaction ratings). | Numerical Data – includes interval scales, which use numbers with equal spacing but lack a true zero (like temperature in Celsius or IQ scores), and ratio scales, which also have equal spacing but include a true zero, making multiplication and division meaningful (like height, weight, income, or exam marks). |
Why is doing this necessary you may ask?
Because of the test that we can apply based on the type of data
Think of your data type (Categorical or Numerical) as the shape of a screw.
And the test you will pick as the screwdriver.
If you don’t know the screw’s shape, you can’t pick the right screwdriver, right?
The same way if you dont know what kind of data is on you then we might have difficulty selecting the right test to find answers.
- Example 1:
If your question is “Do boys and girls score differently in exams?” → here, boys vs girls = categorical, marks = numerical.
The right screwdriver (test) = t-test. - Example 2:
If your question is “Does studying more hours increase marks?” → here, both variables (hours studied, marks) are numerical.
The right screwdriver (test) = correlation or regression.
Check assumptions
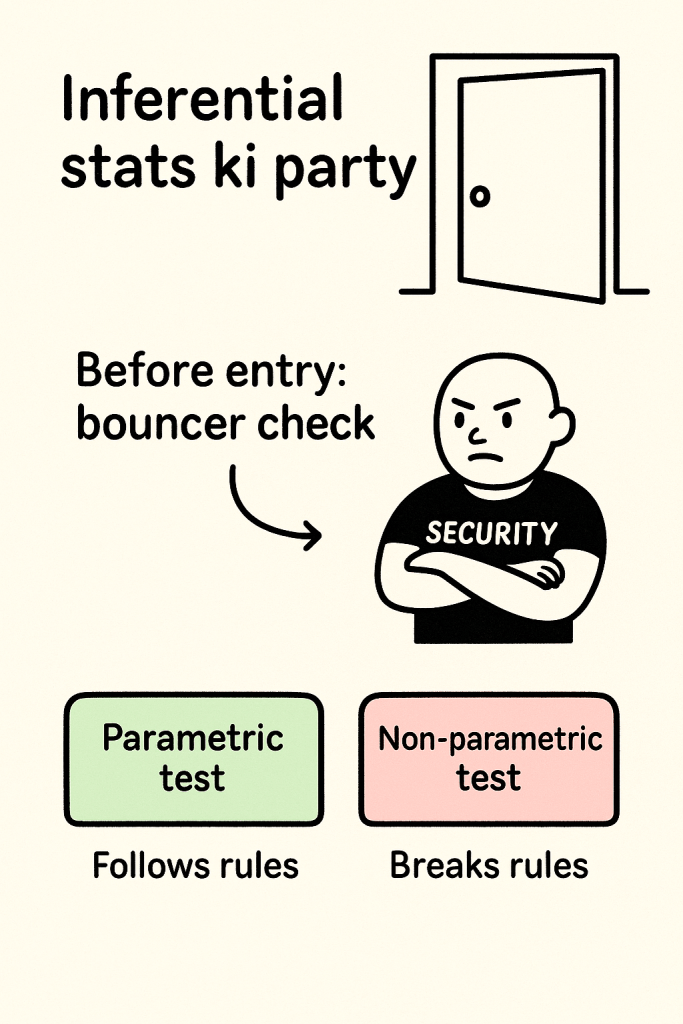
Okay Doston, abhi hum thoda “serious” zone me aa rahe hain-assumptions check Karne ka time! But relax, this is not rocket science. Har test apni ek choti si “condition” ke sath aata hai, jise hum assumptions kehte hain. Think of them as “Party bouncer check”
| Assumptions — one-line cheat-sheet (Keep this one-line assumptions cheat-sheet handy, and apply each rule as soon as that step comes up.) Normality (Shapiro–Wilk) Meaning: Data follows a bell-curve. Parametric if OK: t-test, ANOVA, Pearson correlation, Regression. If violated: Use Mann–Whitney U, Wilcoxon, Kruskal–Wallis, Spearman correlation. Homogeneity of Variances (Levene’s) Meaning: Groups have similar variance. Parametric if OK: Independent t-test, One-way ANOVA. If violated: Use Welch’s t-test, Welch’s ANOVA. Independence of Observations Meaning: Each score is independent. Parametric if OK: Independent samples t-test, Standard ANOVA, Regression. If violated: Use Paired t-test, Repeated measures ANOVA, Mixed models. Linearity Meaning: Variables relate in a straight-line pattern. Parametric if OK: Pearson correlation, Linear regression. If violated: Use Spearman correlation, Polynomial or Non-linear regression. Homoscedasticity Meaning: Residual spread is equal across values. Parametric if OK: Regression, ANOVA, t-test (standard forms). If violated: Use Robust regression, Transformations, Non-parametric alternatives. |
Steps by step Assumptions
Step 1: Identify Variables & Test (no assumptions here)
- Numbers (marks, height) → Parametric test possible.
- Categories/ranks (boys vs girls, favorite fruit) → Non-parametric.
- Example: Boys vs Girls on marks → t-test; Ranking fruits → Mann–Whitney U.
Step 2: Normality
- Ask: Does the data look like a hill (bell-shape)?
- If yes → Use parametric.
- If no/skewed → Use non-parametric.
- Example: Bell-shaped exam marks → t-test. Skewed marks → Mann–Whitney U.
Step 3: Homogeneity of Variances (Levene’s Test can be used)
- Ask: Do groups have a similar spread of scores?
- If yes → Use normal t-test/ANOVA.
- If no → Use Welch’s version.
- Example: Boys’ and girls’ marks equally spread = t-test; Unequal spread = Welch’s t-test.
Step 4: Independence of Observations
- Rule: Each person should appear only once.
- If repeated → Use paired test.
- Example: 30 different students = independent; Same student measured twice = paired t-test.
Step 5: Linearity & Homoscedasticity (for correlation/regression)
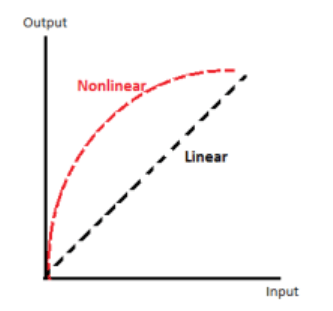
Linearity = Straight-line relation between variables.
- Straight → Pearson/regression.
- Curved → Spearman or non-linear.
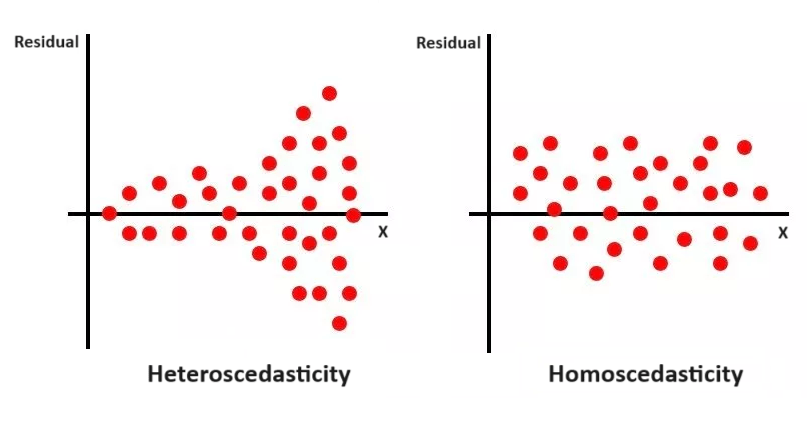
Homoscedasticity = Equal scatter of points.
- Even scatter → Pearson/regression.
- Uneven scatter (funnel shape) → Spearman or adjust data.
Step 6: Outliers

- If no extreme values → Parametric fine.
- If extreme values distort → Fix/remove or use non-parametric.
- Example: Everyone around 40, one student at 100 = outlier.
Step 7: Sample Size Adequacy
- At least 30 per group is safer.
- Small samples = unreliable → better go non-parametric.
- Example: 2 reviews vs 200 reviews on Zomato.
How it works in practice
- Check assumptions (mini-tests/plots/descriptive stats)
- Look at histograms, Q-Q plots, Levene’s test, scatterplots, outliers, sample size.
- Outcome: If the data passes all assumption checks, use a parametric test. If any assumption fails on anyone of the steps, use a non-parametric test. All links must hold for parametric; one broken link → non-parametric.
- Choose the final test
- If all assumptions met → Parametric test.
- If any assumption fails → Non-parametric or adjusted test.
- Run the final test
- This is the only test that tells you if your hypothesis is supported.
Choose the final test or Select appropriate statistical test


CUET-Style Questions: Inferential Statistics Steps
1. Why is it recommended to revisit your research question and hypothesis after descriptive statistics?
A) To change the research topic entirely
B) To ensure the hypothesis still fits the data patterns observed
C) To skip inferential statistics
D) To increase the sample size
2. Which of the following is an example of a categorical independent variable and numerical dependent variable?
A) Hours studied vs exam marks
B) Boys vs girls vs exam marks
C) Ranking favourite fruits vs age
D) Stress levels vs anxiety score
3. What does a Shapiro–Wilk test p-value > 0.05 indicate?
A) Data is skewed → use non-parametric
B) Data is normally distributed → parametric tests allowed
C) Variances are unequal
D) Sample size is inadequate
4. What is the purpose of Levene’s test?
A) Check normality of data
B) Check if group variances are equal
C) Identify outliers
D) Determine linearity of relationship
5. Which situation violates independence of observations?
A) 30 students’ marks recorded once
B) Same student’s marks recorded twice in the same group
C) Exam scores of different classes
D) Random selection of participants
6. In regression analysis, what does homoscedasticity ensure?
A) Data is normal
B) Equal spread of residuals across predictor values
C) Linear relationship exists
D) Sample size is large
7. If your data has extreme outliers, what should you do before inferential testing?
A) Ignore them and proceed
B) Either fix/remove outliers or use a non-parametric test
C) Always increase sample size
D) Use ANOVA only
8. Which step directly influences the choice between parametric and non-parametric tests?
A) Revisiting hypothesis
B) Checking assumptions like normality and variance
C) Reporting results
D) Identifying variables
9. Why is sample size adequacy important in inferential statistics?
A) Small sample → more reliable estimates
B) Central Limit Theorem ensures large samples approximate normal distribution
C) Sample size has no effect on test choice
D) Only categorical variables matter
10. You want to test “Does more study hours improve marks?” Both variables are numerical. Which test is most suitable if assumptions are met?
A) Independent t-test
B) Paired t-test
C) Correlation or regression
D) Chi-square test

Answers Mapping
1 – B
2 – B
3 – B
4 – B
5 – B
6 – B
7 – B
8 – B
9 – B
10 – C


Leave a Reply